%20Text%20(Violet).png)
- Gallery 1: Skeletal imagery emphasising function, not just location of a bone
- Gallery 2: Energy transfer image which proves energy transfer, NOT energy production
- Gallery 3: Correct angles of the muscular system
- Gallery 4: Lever imagery with lever overlay and faded performance image
- Gallery 5: Planes showing motion
- Gallery 6: Muscular contraction image (drawn by Lucy) emphasising the role of the connective tissue
- Gallery 7: VO2max imagery - Use of images at different stages of the learning cycle
- Gallery 8: Tabular data and the use of units and values in the correct locations
- Gallery 9: The importance of graphical data
- Gallery 10: Image variations: One image does huge amounts of work for you if varied
Imagery is impacting and, according to Paivio, this is the case because images and words are coded differently and separately. In essence, Paivio told us that:
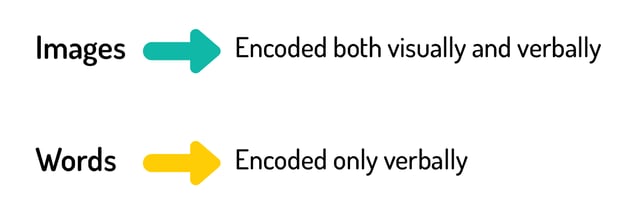
In other words, images can be encoded as memories with greater breadth than words alone on average but, crucially, images combined with words are the most powerful way to encode new information. Once again, this will not surprise PE teachers. It’s common sense. But it also raises the question of what type of imagery PE teachers need to consider using and combined with what type of linguistic information (words).
In my experience, much classroom-based PE teaching and the resources used within it are assumed. The classic example is using a skeleton image and asking students to label it (see list item 1 below). I would imagine that almost every PE teacher reading this post has done this. But if I was to ask those PE teachers “Why did you do it?”, what would they say back to me? If I was to go further and ask, “Why that image?”, “Why that angle?”, “Why labelling?”, what would they say? I believe the majority answer would be “I’m not sure. It’s just what I’ve always done.” I aim to challenge this and to increase the importance of the use of the right imagery at the right time to develop the right skill when teaching PE.
This blog post aims to provide 10 examples of when imagery can be used to gain the maximum learning possible within typical PE experiences. The list is not exhaustive. Rather, these image examples (all of which you may download and use) are representative of what a PE teacher’s aspirations ought to be in relation to imagery in classroom-based PE experiences.
Gallery 1: Skeletal imagery emphasising function, not just location of a bone
I have seen the task to label a skeleton on almost every PE course that I have been exposed to. Labelling a skeleton is just what you do, right? Wrong!! Labelling a skeleton is a poor example of the use of imagery in PE lessons to cause the maximum learning.


Looking at the images above, we can suggest that these are the types of images that PE teachers might use. Lessons will likely involve these images being labelled with the required bones, but skeleton images in isolation are not effective at causing double-barrel learning.
Let’s take an example. If my intention was to develop a student’s awareness of the articulations at particular joints, I might use images like these:

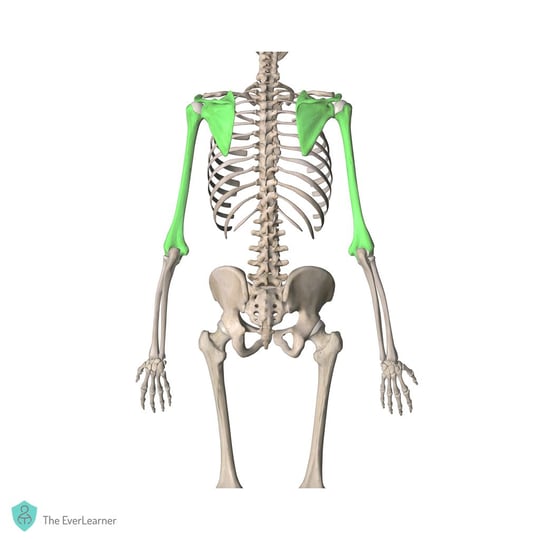
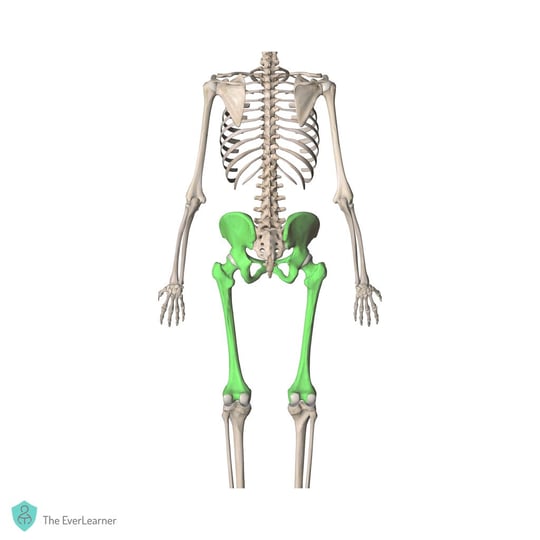
These images, with clear highlighting, emphasise the articulation of joints. They emphasise that the learning to be acquired is which bones work in combination to allow skeletal movement.
Other examples, again of the skeletal system, could be of utilising imagery that clearly shows the function of a bone. Take a look at these two examples:
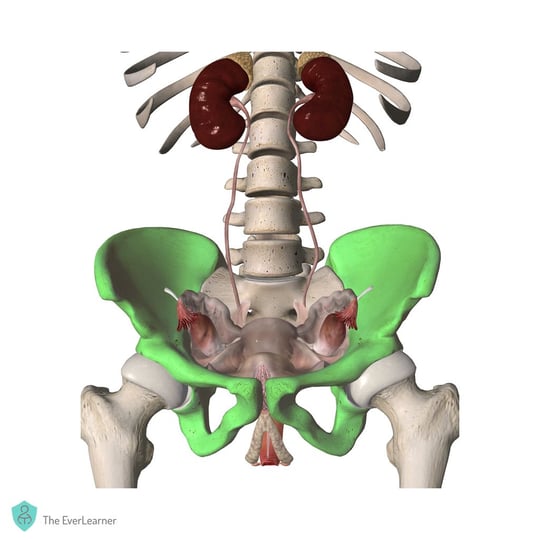
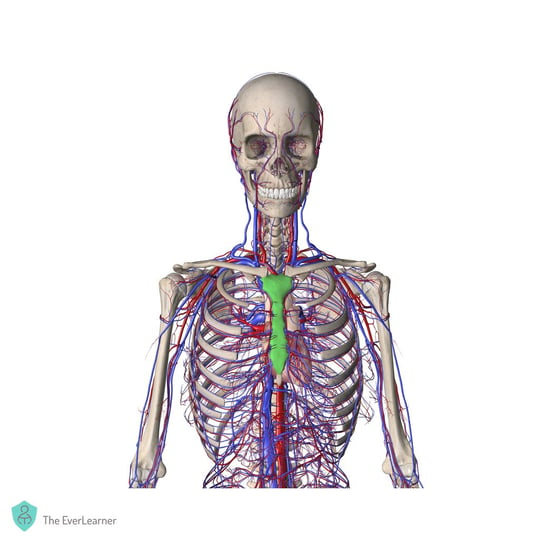

These three images clearly demonstrate the protective characteristics of the flat bones that have been selected and allow a teacher to interleave a knowledge of the function of bones with the position of bones.

Gallery 2: Energy transfer image which proves energy transfer, NOT energy production
Teachers will be perfectly accustomed to this image:
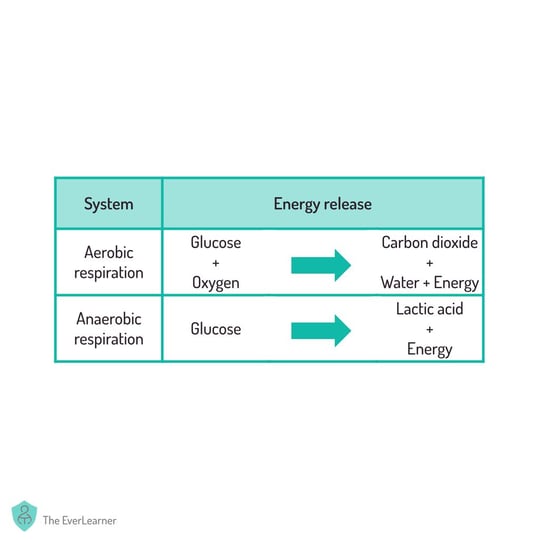
The image clearly summarises the relationship between the reactants and products of aerobic and anaerobic respiration, right? Wrong! The image above is misleading and scientifically inaccurate because it treats “energy” as a product and does not emphasise the energy states of each reaction.
Instead, why not use an image like this?:
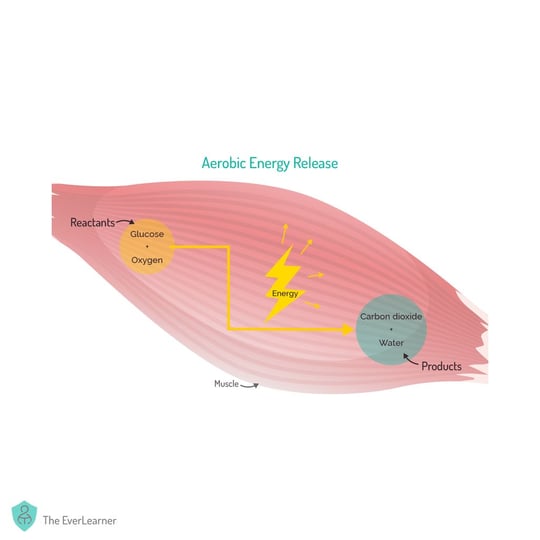
This image is far superior for the following reasons:
- It demonstrates energy release/transfer, NOT energy production.
- It demonstrates that the reactants (glucose + oxygen) have a higher energy state than the products (carbon dioxide + water)
- It demonstrates that energy is transferred, in this case to the kinetic energy store (muscular contraction).
- It can also be compared to the equivalent imagery for anaerobic respiration (see below).
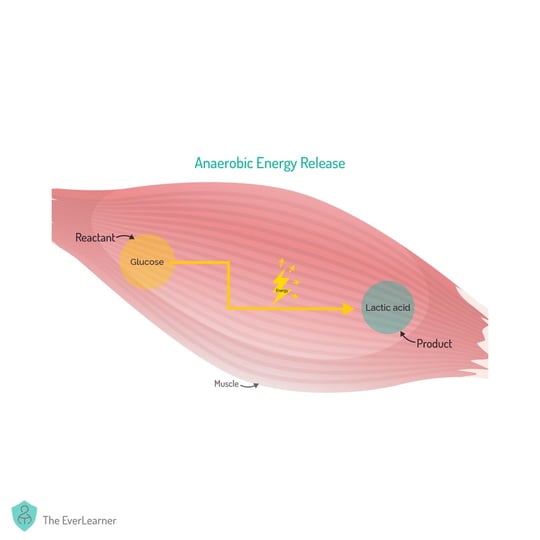
This image is far superior because of the potential to compare it to the aerobic respiration image. Notice the following:
- The energy states change less, with less energy being released. This can help a teacher to discuss the remaining energy potential in lactic acid, for example.
- Less energy is released in total, meaning that this system is more temporary.
- The reaction is simpler, meaning it can happen faster.
With these points in mind, teachers can apply aerobic and anaerobic energy release more to performance and movement applications.
Gallery 3: Correct angles of the muscular system
In my first examples, I showed how skeletal images can be better utilised to cause learning. In this section, I want to specifically discuss the angles of images that can be used to teach about the muscular system.
Once again, in most settings we are likely to find muscular systems being taught by images such as these:


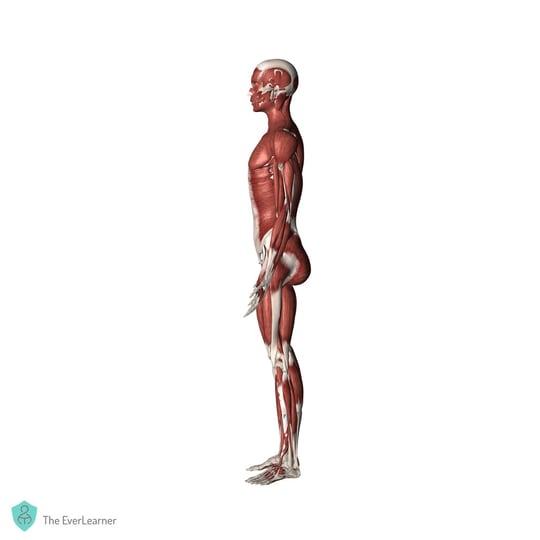
But these generic images do not help us to teach the muscular system effectively.
Take a look at these alternatives below and, specifically, at the angles at which the images have been taken. You will notice that the selected angles are capable of providing specific insight into things such as the nature of a muscle group, the insertion and/or origin of a particular muscle or even the joints which a muscle crosses. In other words, the image angles are specific and educationally relevant.
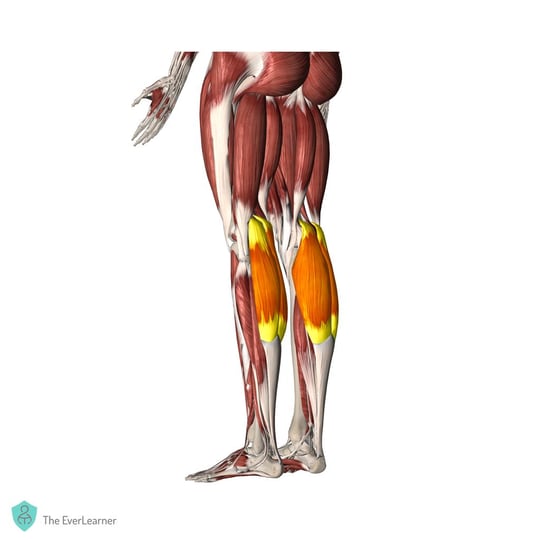
angles view to show different parts of the gastrocnemius
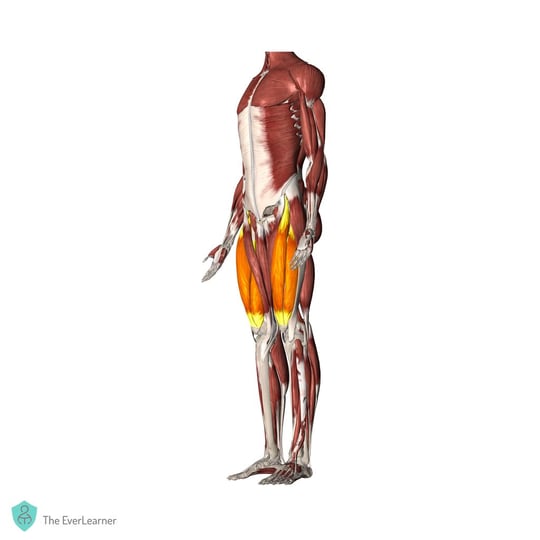
angled view to show all four muscles of the quadriceps group
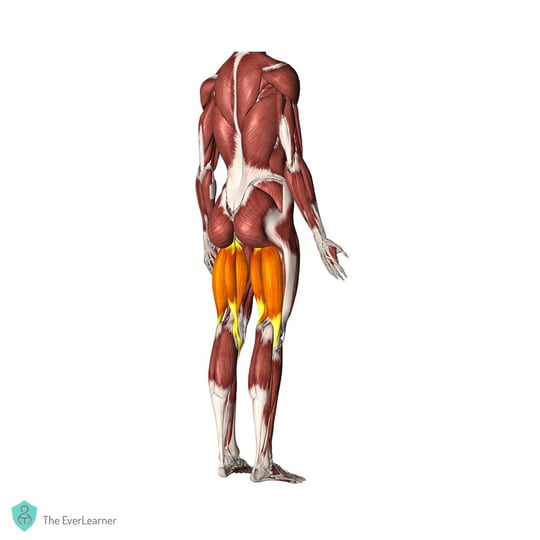
Angled view to show all three muscles of the hamstrings group.
Gallery 4: Lever imagery with lever overlay and faded performance image
In PE teaching, I still see lots of examples where teachers use inappropriate imagery when teaching levers. A classic example would be imagery that demonstrates that a pair of scissors is an example of a first class lever or that a wheelbarrow is an example of a second class lever. Whilst these facts are not incorrect, learning about scissors is not the objective of imagery when teaching levers in PE.
The best way to use imagery is to use image overlay as shown below:
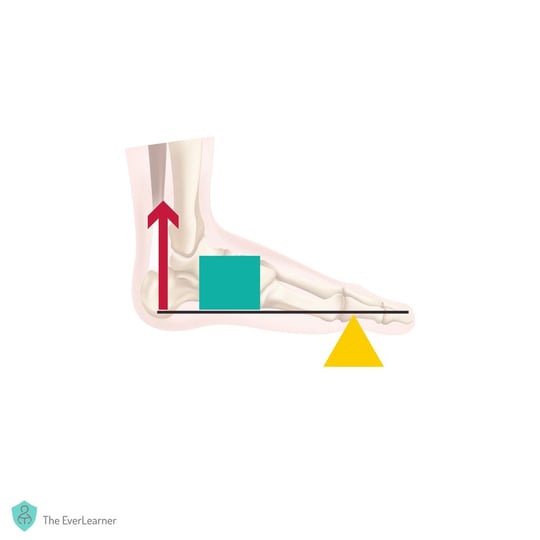
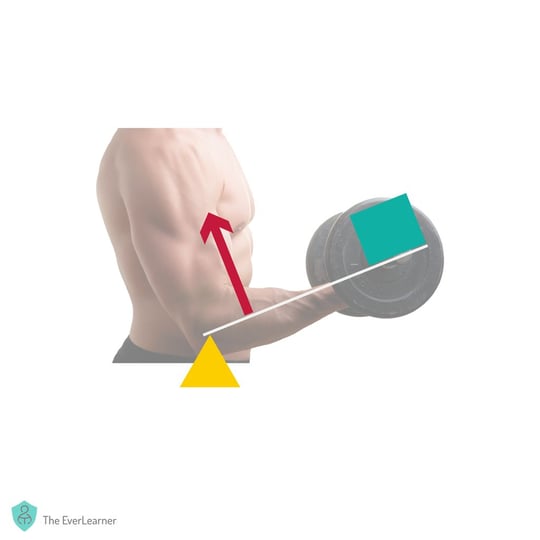
These images, whilst remaining very simple, cause the learner and the teacher to discuss factors such as the following:
- Which lever operates at which joint within the body?
- What are the relative distances between the effort and the fulcrum and the load and the fulcrum respectively?
- What is the insertion point of the muscle (effort) that is generating the force in the system?
These conversations help to deepen our understanding of levers and help the student to retain knowledge for longer. I encourage all PE teachers to consider the types of software they are utilising for their imagery creation and seriously consider creative software such as Affinity, Canva or Adobe Illustrator.
Gallery 5: Planes showing motion
Planes have been taught in most PE courses since 2016. Teachers have often used practical experiences using jelly babies or basic imagery to express the meaning of planes. I want to encourage PE teachers to use images to express movement along planes.
Take a look at these three examples:
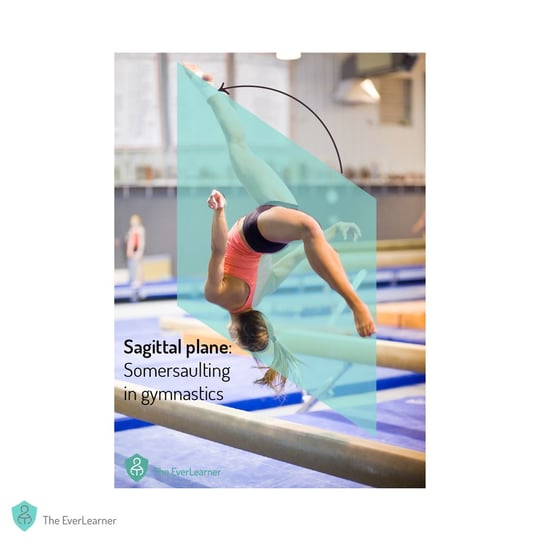
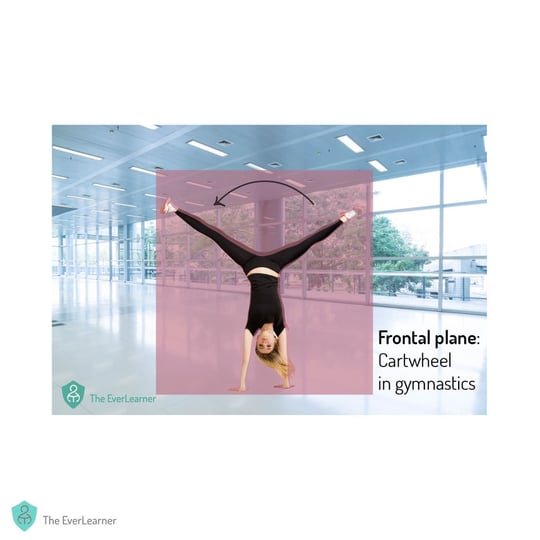
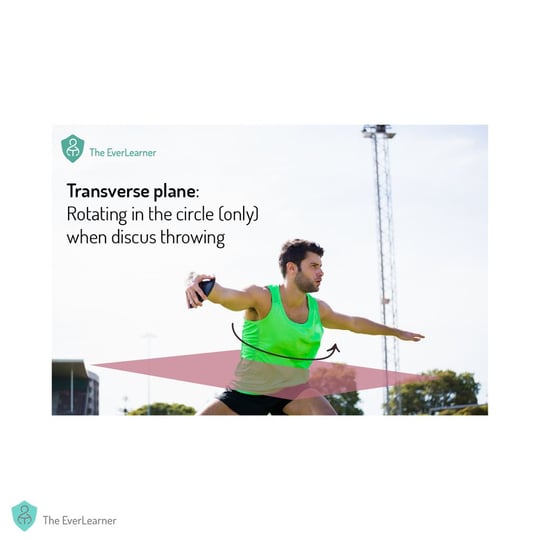
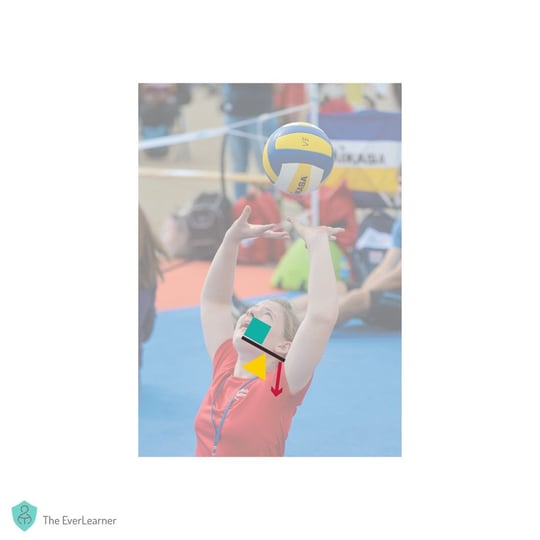
In all three cases, notice the carefully placed and partially transparent nature of the plane. Notice the use of arrows to express motion. These images, without question, express movement along a plane.
I would also like to draw your attention to the wording of the description of the transverse plane. The inclusion of (only) is critical to the image quality, as the image does represent movement along the frontal plane (abduction of the shoulders, for example).
Gallery 6: Muscular contraction image (drawn by Lucy) emphasising the role of the connective tissue
Images can be used to express very clear meaning. In this case, I want students to be able to identify that tendons are the bridging tissue between skeletal muscles and bones. For this reason, I have hand drawn imagery that allows me to express this principle. Take a look at the animation below which is used to emphasise the order in which I would introduce each structure. Notice that the labels (by far the least challenging element of this understanding) are left until last because it is the intuition that I am targeting through my teaching.

I find that using imagery in this way causes intuition. Combined with clear explanations, students go on to fully understand the principle of muscle contraction and the links between muscles and the skeleton. Once they have this intuitive understanding, building the technical language is simple.
Gallery 7: VO2max imagery - Use of images at different stages of the learning cycle
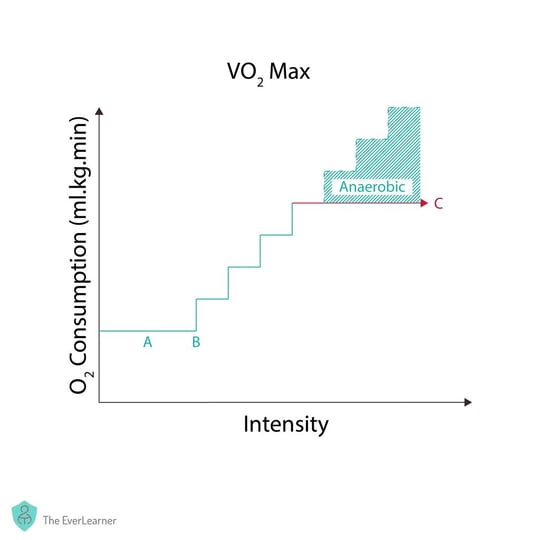
This is a simple example of how to use imagery to build understanding. If I were to teach the concept of VO2max, for example, I might use imagery in the following way:
Introduce image 1 and discuss it. This image allows me to ask questions of the students. My initial question might be something like: look closely at the axes and title of the graph and then tell me what is happening at points A, B and C.
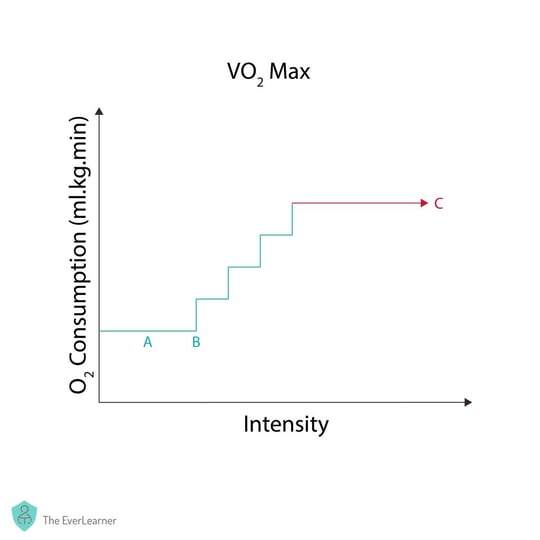
Normally, students can tell me that A represents rest and that B represents the start of exercise. But, sometimes, they struggle to tell me what is happening at C. Typically, I will guide the students back to the x and y axes and remind them that, at point C, exercise intensity is increasing but that O2 consumption does not increase. After a short discussion, I introduce them to another version of the image:
Typically, students now find it easier to understand that exercise is continuing at a higher intensity but that this increase is powered anaerobically, not aerobically. In other words, the athlete is working at their VO2Max at point C and their continuation in the exercise is temporary because of the temporary and fatiguing nature of the anaerobic systems. Students are also able to recognise that this graph represents a multi-stage fitness test or a ramp test or equivalent.
Once this understanding is clear, I introduce the final image and then formalise the definition of VO2Max:
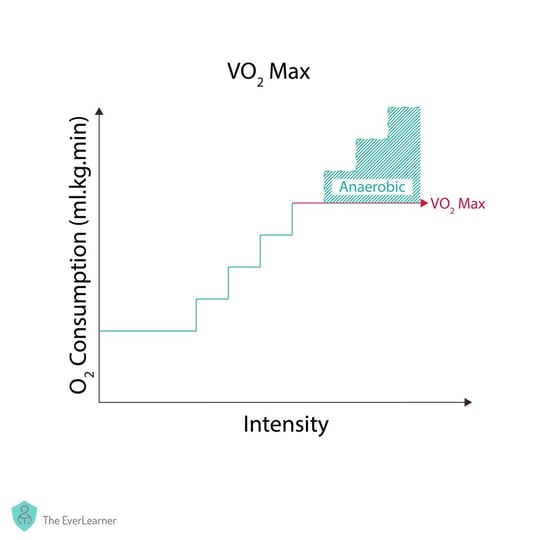
When you consider that VO2Max can be defined as the maximal volume of oxygen that can be taken in, transported and consumed per minute, students, having been exposed to these images, are fully equipped to understand the concept and how it relates to performance.
Gallery 8: Tabular data and the use of units and values in the correct locations
Data tables are very common in PE teaching and PE teachers should be confident in how to present them. Take a look at this example:
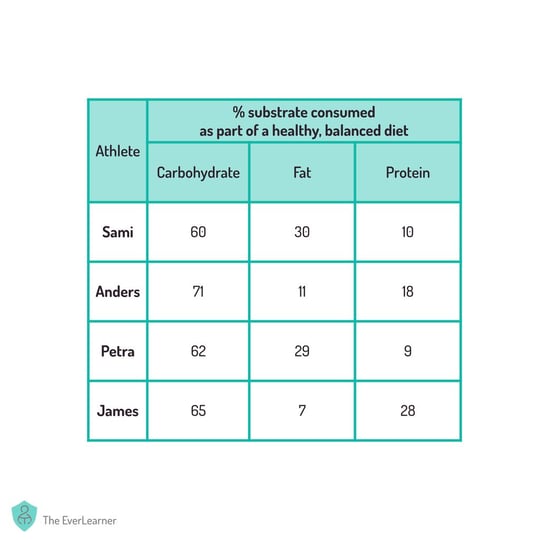
I would like to draw your attention to the columns. Please notice that the unit of measurement (in this case %) has been separated from the terms carbohydrate, fat and protein. This is good practice and would be considered by, amongst others, science teachers as scientifically accurate. In PE, we should have exactly the same standards.
Take a look at another example:
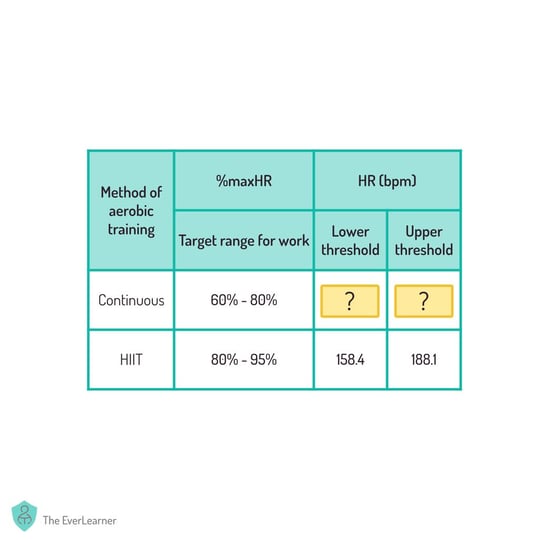
This image represents the same principle but, this time, with a greater range of units. I urge PE teachers to follow this principle whenever they teach with data tables. I also urge PE teachers to cause students to work with data as frequently as possible.
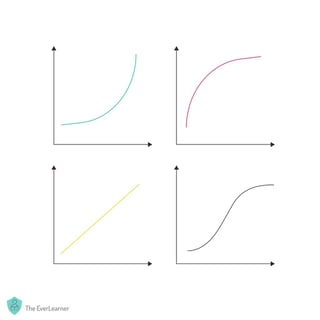
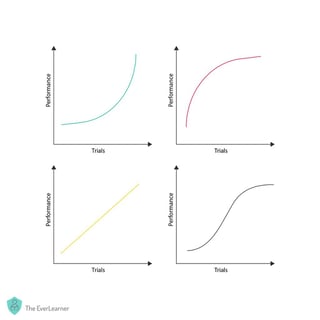
Gallery 9: The importance of graphical data
It is essential that PE teachers are able to work with graphical imagery. Students are expected to interpret graphs in many PE exams and the skill of graphical interpretation and production should be built into a classroom-based PE experience.
I have included a few examples below of what I consider to be exemplary graphical imagery. Please pay attention to the clarity of the imagery but, more importantly, the potential for asking questions about the data and having students interpret it.
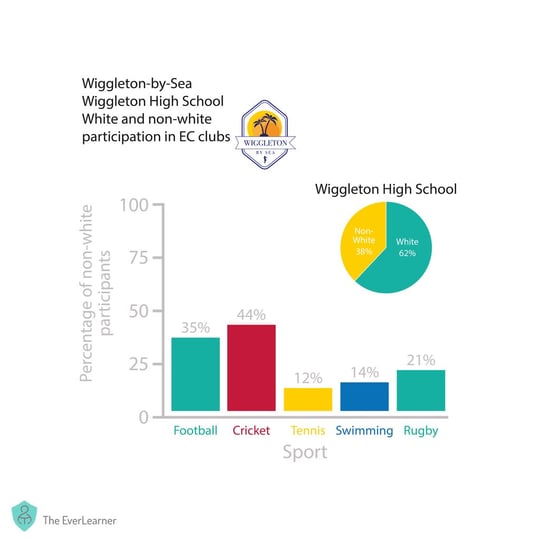
This graph, at first glance, is quite complex. But, once considered fully, it is incredibly simple and the data trends are very clear. For example, it is straightforward to analyse that non-white students are underrepresented in three sports, overrepresented in one and approximately proportionally represented in one sport at Wiggleton High School.
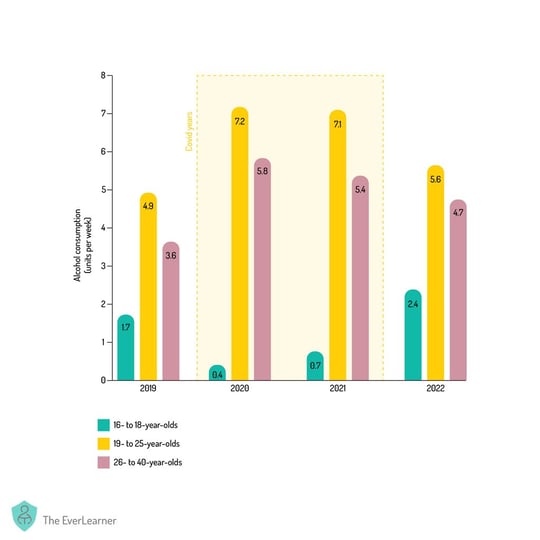
Once again, this image can take a few moments to interpret but the clarity of the graphical data allows a student to extract a great deal of information. If I were to ask these questions to students, what would they answer?
- What was the impact of COVID lockdowns on underage alcohol consumption?
- What was the impact of COVID lockdowns on adult alcohol consumption?
- Compare alcohol consumption pre-COVID to post-COVID.
In all cases, students can accurately extract meaning from the data that is presented.
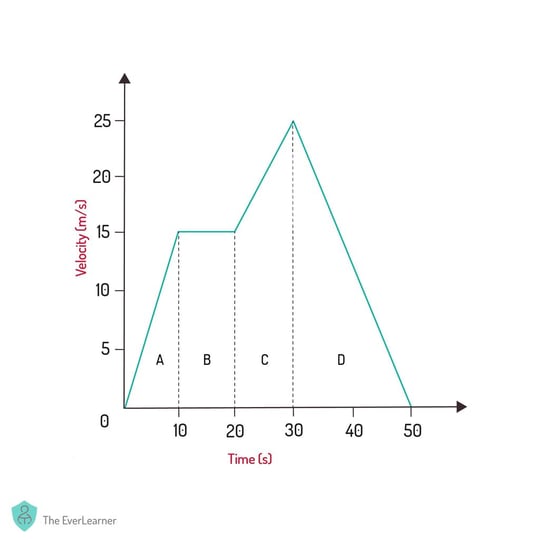
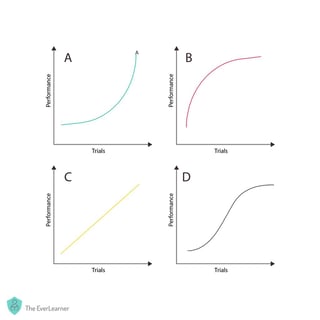
This image, probably used within a biomechanics course, is an excellent resource to cause discovery learning. Assuming that students have a working knowledge of acceleration/deceleration and velocity, a teacher should be able to provide this graph and simply ask the following questions:
- What is occurring in zones A, B, C and D?
- State one type of performer who might produce a velocity/time graph like this.
You might even choose to ask an exam style question such as this:
- This graph represents the performance of a 400m runner who finished seventh in the race. Using the graph, describe what might have happened during the second half of the race. (4 marks)
Therefore, I urge PE teachers to seriously consider the extent to which they are capable of producing graphical imagery and to consider that graphical imagery is a core requirement of a classroom-based PE teacher.
Gallery 10: Image variations: One image does huge amounts of work for you if varied
Finally, I want to encourage PE teachers to consider how to get the most out of their creative time. When you make images, consider a range of image variations that you can use now and in the future.
Take a look at these examples (there are more in the FREE download):


Conclusions
Firstly, thank you for reaching the end of the post. To be honest, it’s a bit of a monster and, if you’ve reached the end, you have read a lot about imagery.
It took me a long time in my career to realise that imagery was critical to learning. For many years, I followed assumed models of how to teach and how to present material. Once I challenged this idea, it became impossible not to use high-quality imagery.
I also want to address heads of PE directly. At least some members of your team should be capable of producing high-quality visual content and, if they’re not, you should be investing in these skills as soon as possible. I also urge you to be wary of sharing sites. Whilst collaborative resource sharing is to be applauded, we all need to recognise that a great many resources included on sharing platforms do not achieve the standards that I have discussed in this post. This should also mean that teachers who make outstanding imagery should be cautious in simply giving their creations away. Remember that your work has value and you must value it yourself.